RESEARCH
Third Party Efficacy Studies
Independent Evaluations of Post-Pandemic Recovery
Independent Evaluations of Post-Pandemic Recovery
Zearn Math has received a “Strong” (Tier 1) rating from Evidence for ESSA — the highest designation from a nationally recognized, independent clearinghouse that evaluates education research to help schools, districts, and states select evidence-based programs. This top rating confirms that Zearn Math meets the rigorous evidence standards outlined in the Every Student Succeeds Act (ESSA).
Zearn Math has received a “Strong” (Tier 1) rating from Evidence for ESSA — the highest designation from a nationally recognized, independent clearinghouse that evaluates education research to help schools, districts, and states select evidence-based programs. This top rating confirms that Zearn Math meets the rigorous evidence standards outlined in the Every Student Succeeds Act (ESSA).
Zearn Math has received a “Strong” (Tier 1) rating from Evidence for ESSA — the highest designation from a nationally recognized, independent clearinghouse that evaluates education research to help schools, districts, and states select evidence-based programs. This top rating confirms that Zearn Math meets the rigorous evidence standards outlined in the Every Student Succeeds Act (ESSA).
Texas Randomized Controlled Trial (2022–2024) | RAND
A large-scale randomized controlled trial, conducted across 10,000 students in grades 3–5 in 64 schools in a large urban Texas district, found causal evidence of positive, statistically significant impacts of Zearn on student math achievement, as measured by the nationally normed NWEA MAP Growth assessment.
Lorem ipsum dolor sit amet, consectetur adipiscing elit. Suspendisse varius enim in eros elementum tristique. Duis cursus, mi quis viverra ornare, eros dolor interdum nulla, ut commodo diam libero vitae erat. Aenean faucibus nibh et justo cursus id rutrum lorem imperdiet. Nunc ut sem vitae risus tristique posuere.
A large-scale randomized controlled trial, conducted across 10,000 students in grades 3–5 in 64 schools in a large urban Texas district, found causal evidence of positive, statistically significant impacts of Zearn on student math achievement, as measured by the nationally normed NWEA MAP Growth assessment.
A large-scale randomized controlled trial, conducted across 10,000 students in grades 3–5 in 64 schools in a large urban Texas district, found causal evidence of positive, statistically significant impacts of Zearn on student math achievement, as measured by the nationally normed NWEA MAP Growth assessment.
A large-scale randomized controlled trial, conducted across 10,000 students in grades 3–5 in 64 schools in a large urban Texas district, found causal evidence of positive, statistically significant impacts of Zearn on student math achievement, as measured by the nationally normed NWEA MAP Growth assessment.
A large-scale randomized controlled trial, conducted across 10,000 students in grades 3–5 in 64 schools in a large urban Texas district, found causal evidence of positive, statistically significant impacts of Zearn on student math achievement, as measured by the nationally normed NWEA MAP Growth assessment.
- Zearn had a positive and statistically significant impact of +0.11 standard deviations (SD) on students’ NWEA MAP scores. That impact was slightly larger — +0.13 SDs — for students who began below proficiency. These impacts are equivalent to a four-percentile increase in math achievement over two years. These statistically significant MAP findings were designated as exploratory outcomes.
- On the Texas STAAR exam — the study’s confirmatory measure designed to assess on-grade proficiency — students in Zearn schools scored +0.07 standard deviations higher than peers not using Zearn, rising to +0.10 SD for students who began below proficiency. While positive, these gains did not reach statistical significance.
- Effects for English learners, while positive, were smaller than for other subgroups. In response, Zearn is launching a multi-year rollout of Spanish-translated digital lessons beginning in the 2025–26 school year.
Louisiana Quasi-Experimental Design Study (2023–2024) | CRRE AT JOHNS HOPKINS UNIVERSITY
A quasi-experimental study (2023–2024) of over 7,000 students in grades 4–8 in three suburban and rural Louisiana districts found districts using Zearn with dedicated implementation support (e.g, school coaching, educator training, usage monitoring) significantly outperformed peers on the state math assessment.
Lorem ipsum dolor sit amet, consectetur adipiscing elit. Suspendisse varius enim in eros elementum tristique. Duis cursus, mi quis viverra ornare, eros dolor interdum nulla, ut commodo diam libero vitae erat. Aenean faucibus nibh et justo cursus id rutrum lorem imperdiet. Nunc ut sem vitae risus tristique posuere.
A quasi-experimental study (2023–2024) of over 7,000 students in grades 4–8 in three suburban and rural Louisiana districts found districts using Zearn with dedicated implementation support (e.g, school coaching, educator training, usage monitoring) significantly outperformed peers on the state math assessment.
A quasi-experimental study (2023–2024) of over 7,000 students in grades 4–8 in three suburban and rural Louisiana districts found districts using Zearn with dedicated implementation support (e.g, school coaching, educator training, usage monitoring) significantly outperformed peers on the state math assessment.
A quasi-experimental study (2023–2024) of over 7,000 students in grades 4–8 in three suburban and rural Louisiana districts found districts using Zearn with dedicated implementation support (e.g, school coaching, educator training, usage monitoring) significantly outperformed peers on the state math assessment.
A quasi-experimental study (2023–2024) of over 7,000 students in grades 4–8 in three suburban and rural Louisiana districts found districts using Zearn with dedicated implementation support (e.g, school coaching, educator training, usage monitoring) significantly outperformed peers on the state math assessment.
- Zearn had a positive and statistically significant impact of +0.20 standard deviations (SD) on students' math LEAP scores, Louisiana's state assessment.
- Gains were consistent across student subgroups, including English learners, economically disadvantaged students, and students with disabilities.
- Study authors note that this effect size represents a large practical impact of Zearn on LEAP scores, based on widely accepted benchmarks for interpreting educational interventions (Kraft, 2020).
State & district studies
Evidence of Impact from Consistent Zearn Usage
Evidence of Impact from Consistent Zearn Usage
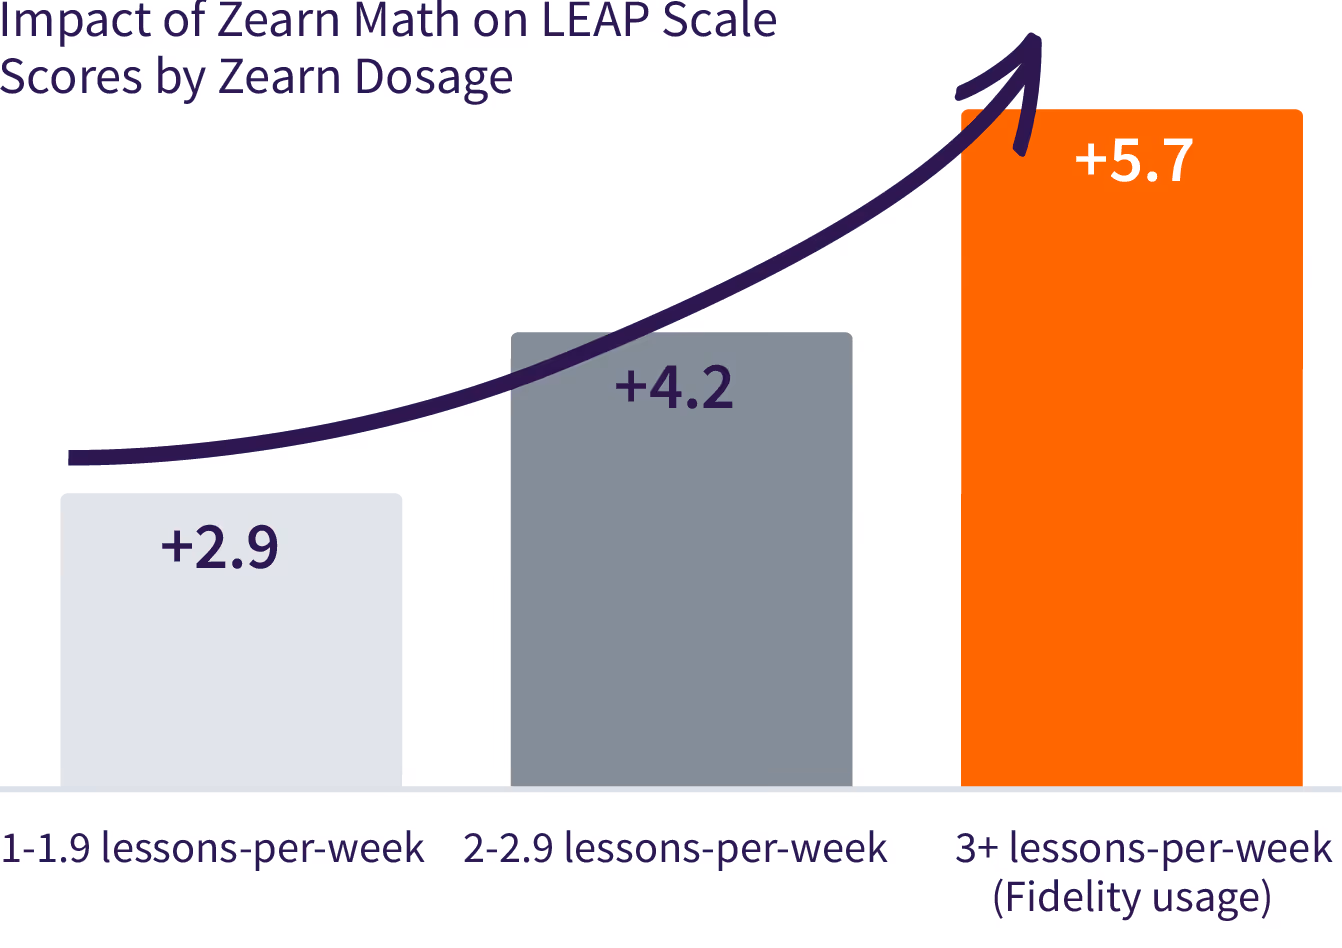
State and district impact studies examine the effect of consistent Zearn Math usage on state and interim assessment scores. Quasi-experimental research shows that students who consistently complete 3 or more grade-level Zearn Math lessons per week (with each lesson taking around 30 minutes) outperform matched peers who do not engage with the platform. Learn more about the methodology of each treatment-on-the-treated study.
State and district impact studies examine the effect of consistent Zearn Math usage on state and interim assessment scores. Quasi-experimental research shows that students who consistently complete 3 or more grade-level Zearn Math lessons per week (with each lesson taking around 30 minutes) outperform matched peers who do not engage with the platform. Learn more about the methodology of each treatment-on-the-treated study.
State and district impact studies examine the effect of consistent Zearn Math usage on state and interim assessment scores. Quasi-experimental research shows that students who consistently complete 3 or more grade-level Zearn Math lessons per week (with each lesson taking around 30 minutes) outperform matched peers who do not engage with the platform. Learn more about the methodology of each treatment-on-the-treated study.
TEXAS 2023 STAAR MATH SCORE GROWTH
Consistent Zearn usage significantly increases math scores across usage levels

NEBRASKA 2022 NSCAS MATH SCORE GROWTH
Fidelity Zearn usage results in 2.5 times the growth in math scores

Louisiana 2022 and 2023 LEAP Math Score Growth
Two-year study finds consistent Zearn usage increase math scores
DCPS 2022 I-READY DIAGNOSTIC
Students who use Zearn with fidelity outscore matched peers across all starting levels of math achievement

Platform insights
Advancing Math Teaching and Learning
Advancing Math Teaching and Learning
Data from billions of math problems completed on the Zearn platform is used to continuously improve math teaching learning.
Data from billions of math problems completed on the Zearn platform is used to continuously improve math teaching learning.
Data from billions of math problems completed on the Zearn platform is used to continuously improve math teaching learning.
Learning Recovery
Opportunity Insights
Researchers from Harvard and Brown Universities use Zearn data to provide real-time visibility into the pandemic's impact on math learning
Learning Acceleration
Catching Up and Moving Forward
Statistically significant quasi-experimental evidence supporting learning acceleration to support student progress in math
Implementation at scale
Behavior Change for Good
In a national megastudy involving 3M students, researchers find personalized email nudges to teachers boost elementary math progress